

Cast Iron Motor OEM Suppliers
As a seasoned supplier in the heavy machinery field, I focus on Cast Iron Motor solutions for OEM and Suppliers who demand reliability and long life. My Cast Iron Motor combines a rugged cast iron housing with precision windings, delivering high torque, excellent heat dissipation and steady performance under continuous operation. We design these motors to fit standard industrial drives and custom OEM specs, with flexible shaft options, mounting feet, and waterproofing grades. When you contact me, I can provide fast samples, competitive quotes, and scalable production that grows with your demand. You’ll appreciate the low maintenance and extended service life, even in tough environments. I keep tight tolerances and strict QA so your assembly line keeps running smooth. If you need a robust, cost-effective Cast Iron Motor for your machinery, I’m ready to work with you, as a trusted OEM supplier ready to support your project.


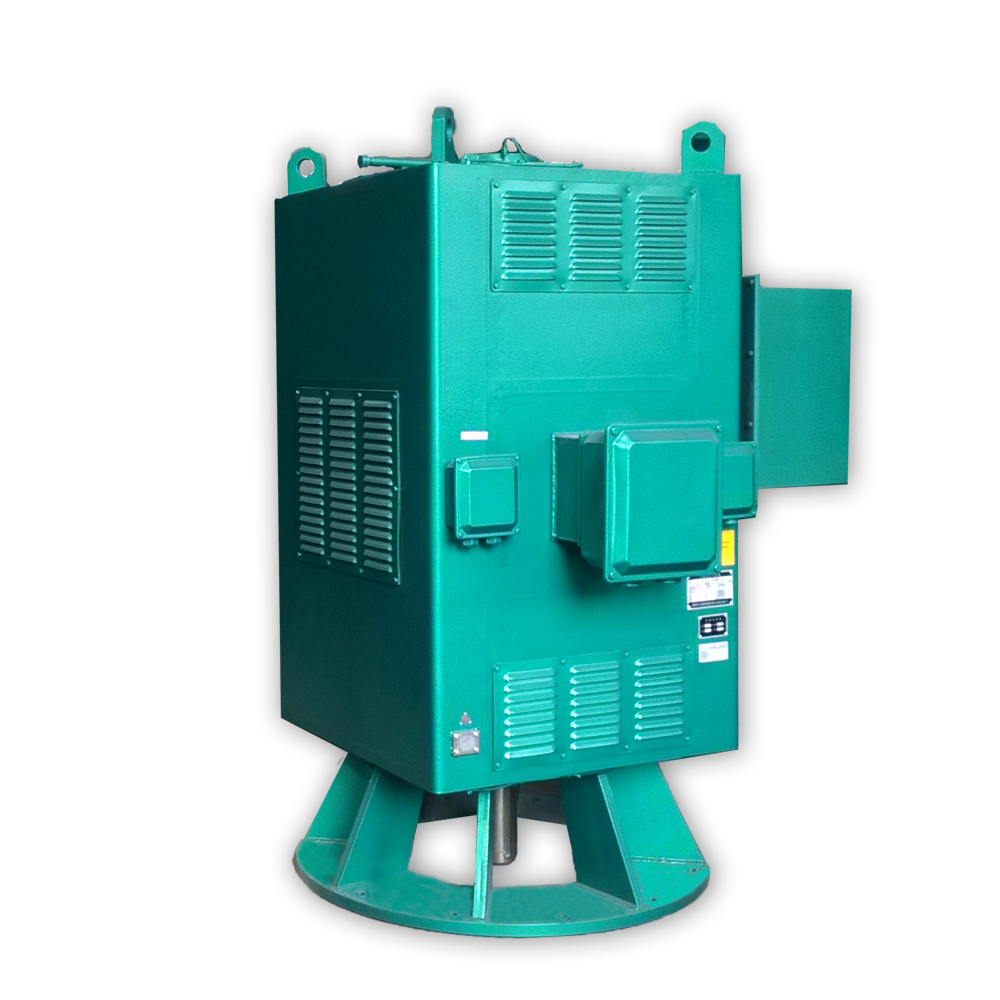

Cast Iron Motor Service Leads the Global Market
A cast iron motor service leads the global market by delivering rugged reliability and precise engineering. Cast iron frames resist heat, impact, and wear in tough environments, providing steady torque and long life. With strict quality control and standardized processes, these motors perform consistently across manufacturing, mining, pumps, and material handling. Global buyers benefit from a seamless supply chain: scalable production, diversified sourcing, and reliable logistics that protect lead times. A top supplier offers a broad range of sizes and mounting options, plus engineering collaboration, spare parts support, and responsive technical service. Energy-efficient designs and proactive maintenance programs help reduce total cost of ownership and downtime for sites around the world.
Cast Iron Motor Service Leads the Global Market
| Year | Region | Country | Market Segment | Installed Base (Units) | Average Efficiency Class | MTBF (Hours) | Availability (%) | Downtime (Hours/Year) | New Installations (Units) |
|---|---|---|---|---|---|---|---|---|---|
| 2024 | North America | United States | Industrial OEMs | 420,000 | IE3 | 15,000 | 98.6 | 220 | 5,200 |
| 2024 | Europe | Germany | Heavy Industry | 310,000 | IE3 | 15,500 | 98.8 | 210 | 4,400 |
| 2023 | Asia-Pacific | China | Automations | 680,000 | IE3 | 14,200 | 97.9 | 260 | 8,700 |
| 2023 | Asia-Pacific | India | Small Scale Manufacturing | 150,000 | IE2 | 13,000 | 98.2 | 270 | 2,300 |
| 2024 | Middle East & Africa | United Arab Emirates | Oil & Gas | 90,000 | IE3 | 14,000 | 97.5 | 300 | 1,200 |
| 2022 | Europe | France | Utilities | 110,000 | IE2 | 12,500 | 97.8 | 290 | 1,500 |
Related Products


Cast Iron Motor Supplies the World\u2019s Top Brands From Concept to Delivery
Top Selling Products


- Related Blog
- Reviews
- Reviews
