

Rotating Motor Wholesale & Manufacturers | High-Quality Solutions
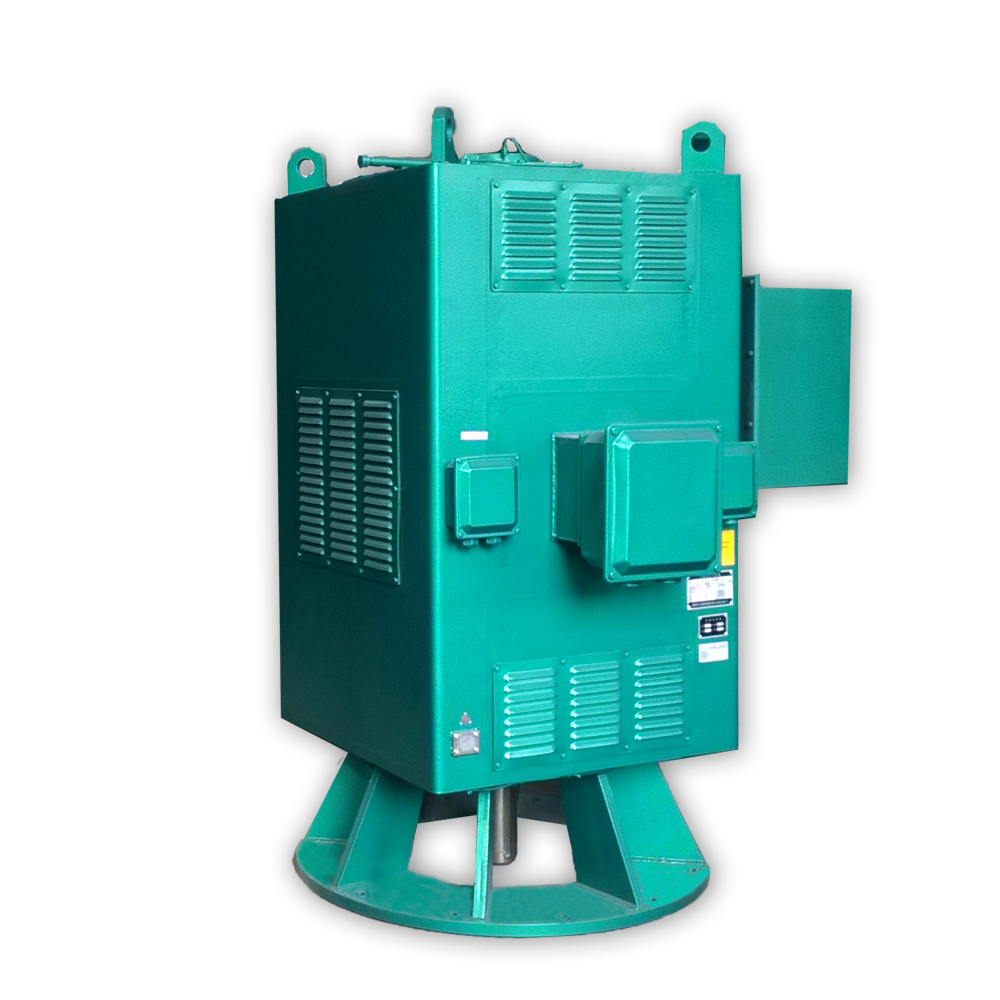
From my side, I supply a Rotating Motor designed for serious production lines. If you’re in Wholesale or Manufacturers looking for steady supply, you’ll value its reliability, energy efficiency, and long service life. The motor delivers robust torque, smooth operation, and low vibration across high-load runs, with options for IP ratings, gear coupling, and variable speeds. It comes in multiple frame sizes and voltage ranges, so it fits conveyors, packaging, and textile equipment without heavy rework. I keep stock for fast shipping and offer bulk pricing for large projects, along with technical support from our engineers. You’ll also get clear documentation, warranties, and replacement parts to minimize downtime. Our Rotating Motor is built for continuous operation, easy maintenance, and predictable performance under demanding environments. If you need a dependable partner for your production line, I’m ready to quote and tailor a solution that scales with your business.




Rotating Motor Dominates in 2025
Rotating motors are becoming the default for 2025, reshaping procurement for equipment and automation. Energy efficiency, compact form, and smarter control enable higher torque across wider speed ranges while reducing energy bills and maintenance costs. From brushless DC to premium induction solutions, buyers gain reliable performance when paired with drives and sensors. The move is driven by automation roadmaps, energy standards, and the need for resilient supply chains. Standardized safety and performance criteria help sourcing across regions. To capture this momentum, prioritize total cost of ownership over upfront price: energy savings, longer life, easier spare parts planning, and robust warranties. Key criteria include efficiency class, torque density, thermal management, quiet operation, IP rating, and drive readiness documentation. A capable supplier offers rigorous testing, traceable data, and flexible lead times to support global operations. With the right partnerships, rotating motors power the next wave of automated production, sustainable equipment, and resilient infrastructure, delivering dependable performance and value across diverse markets.
| Region | Motor Type | Efficiency Class | Nominal Power (kW) | Max RPM | Torque (Nm) | Voltage (V) | Current (A) | MTBF (hours) | Adoption Rate (%) | Market Share (%) |
|---|---|---|---|---|---|---|---|---|---|---|
| North America | Induction | IE3 | 4.0 | 1800 | 24 | 480 | 8.0 | 250000 | 58 | 22 |
| North America | Synchronous | IE4 | 7.5 | 1800 | 40 | 480 | 15.0 | 270000 | 62 | 25 |
| North America | BLDC | IE4 | 1.5 | 3000 | 4.8 | 400 | 3.6 | 320000 | 65 | 18 |
| Europe | Induction | IE3 | 5.5 | 1500 | 35 | 400 | 12.0 | 260000 | 60 | 20 |
| Europe | Synchronous | IE4 | 11.0 | 1800 | 60 | 400 | 28.0 | 290000 | 70 | 28 |
| Europe | BLDC | IE4 | 2.2 | 3000 | 15 | 400 | 5.0 | 320000 | 68 | 12 |
| Asia-Pacific | Induction | IE3 | 22.0 | 1800 | 120 | 400 | 60.0 | 260000 | 55 | 25 |
| Asia-Pacific | Synchronous | IE4 | 45.0 | 1500 | 240 | 400 | 110.0 | 300000 | 72 | 28 |
| Asia-Pacific | BLDC | IE4 | 1.5 | 3000 | 4.5 | 400 | 4.5 | 350000 | 70 | 8 |
| Latin America | Induction | IE3 | 3.0 | 1500 | 22 | 460 | 7.0 | 240000 | 50 | 18 |
| Latin America | Synchronous | IE4 | 4.0 | 1500 | 28 | 380 | 9.0 | 280000 | 57 | 12 |
| Latin America | BLDC | IE4 | 0.75 | 3000 | 4.0 | 400 | 2.0 | 340000 | 60 | 5 |
| Middle East & Africa | Induction | IE3 | 7.5 | 1500 | 48 | 400 | 18.0 | 260000 | 52 | 14 |
| Middle East & Africa | Synchronous | IE4 | 11.0 | 1800 | 62 | 400 | 26.0 | 290000 | 65 | 20 |
| Middle East & Africa | BLDC | IE4 | 2.2 | 3000 | 16 | 400 | 6.0 | 330000 | 68 | 10 |
Related Products


Rotating Motor Factory More Than a Supplier - A Partner
Top Selling Products


- Related Blog
- Reviews
- Reviews
